“Recently, many global and regional pharma companies are reaching out to us to source innovative assets in China – not only as bolt-on opportunities, but as an anchor to strengthen internal R&D capabilities and rebuild asset pipelines. What’s driving this interest is not a single “hot area,” but an ecosystem-level shift: China is producing more assets, better modality mix, faster early readouts, and increasingly partnerable packages.”
1) China’s innovative asset base has scaled – now it’s a meaningful global source
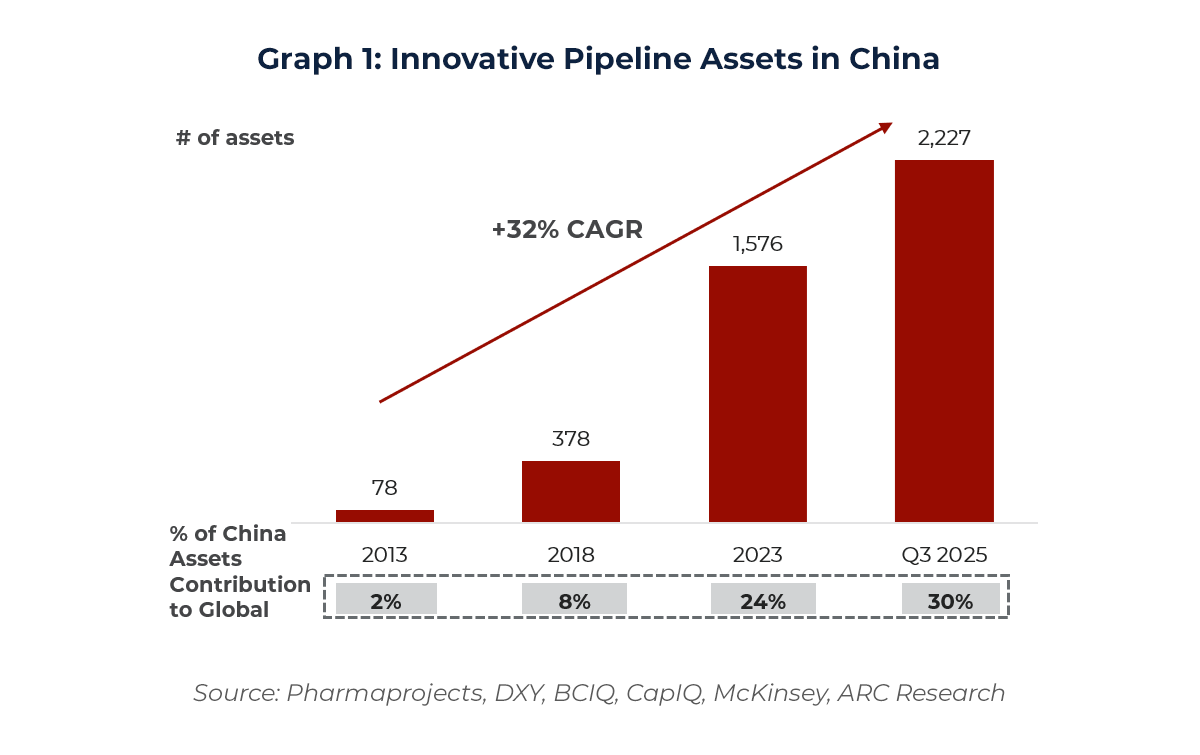
China’s innovative pipeline expanded from 78 assets in 2013 to 2,227 assets by Q3 2025, implying roughly ~32% CAGR. This scale-up is a major reason China now contributes ~30% of the global innovative pipeline. In other words, China has moved from a niche innovation market to a material global source of pipeline assets.
 Future outlook: after 2025, “quality growth” matters more than “quantity growth”
Looking beyond 2025, China’s innovative pipeline will likely continue growing, but the growth rate should moderate relative to the 2019–2025 surge. The next phase is expected to show several clear patterns:
- Less quantity growth, more quality growth: fewer low-differentiation programs, more assets designed to meet global standards. The pipeline asset would have cleaner data package, stronger CMC readiness, robuster IP.
- Consolidation accelerates: weaker biotechs drop programs, merge, or pivot; stronger platforms keep adding assets and expanding modality depth.
- Growth shifts beyond oncology: oncology remains large, but immunology and cardiometabolic are expected to grow faster, with selective expansion in CNS/derm/women’s health.
- More partnering-driven development: tighter VC/IPO exits push companies to fund pipelines through out-licensing and NewCo, so the market will see more assets “converted into deals,” not just counted as programs.
2) The story is not just “more assets” – it’s a better modality mix
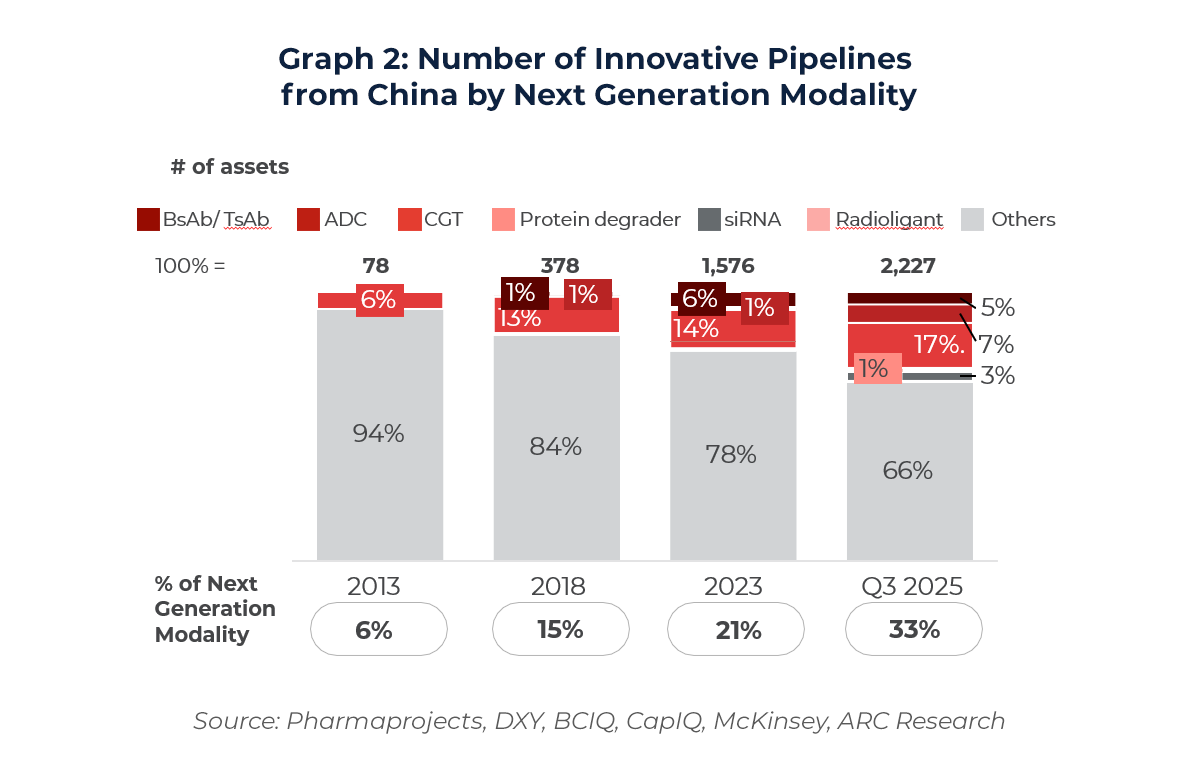
The more important change is the modality upgrade. Next-generation modalities increased from ~6% in 2013 to ~33% by Q3 2025, meaning roughly one-third of China’s innovative pipeline is now next-gen.
 The growth is concentrated in the exact modalities many partners prioritize:
- Bispecifics: from near zero to ~5%
- ADCs: from near zero to ~7%
- Cell & gene therapy (CGT): from ~6% to ~17%
China is not only scaling up—it is scaling into the right kinds of innovation assets.
Why did CGT rise to ~17% (an ~11 percentage-point increase)?
CGT’s share rose because CGT programs expanded faster than the overall pipeline, reflecting a shift from “experimental” to “repeatable” execution. Three reasons explain this acceleration:
- Faster, clearer readouts in the right indications
In areas such as hematologic malignancies (and selected solid tumors), CGT—especially CAR-T—can generate meaningful responses relatively quickly, enabling earlier proof-of-concept and attracting more teams and capital. - Platform-like scalability
Once a company builds the core system (vector/process, QC/release standards, clinical operations), it can add new targets and constructs faster—so pipelines expand more quickly than modalities that require rebuilding the system each time. - China’s execution strengths match CGT bottlenecks
Globally, CGT is constrained by enrollment speed, manufacturing delivery, and operational coordination. China’s dense clinical sites and patient access, combined with strong CRO/CDMO infrastructure and cost efficiency, help reduce these bottlenecks.
3) Therapeutic area breakdown: oncology is still the anchor, but diversification is real
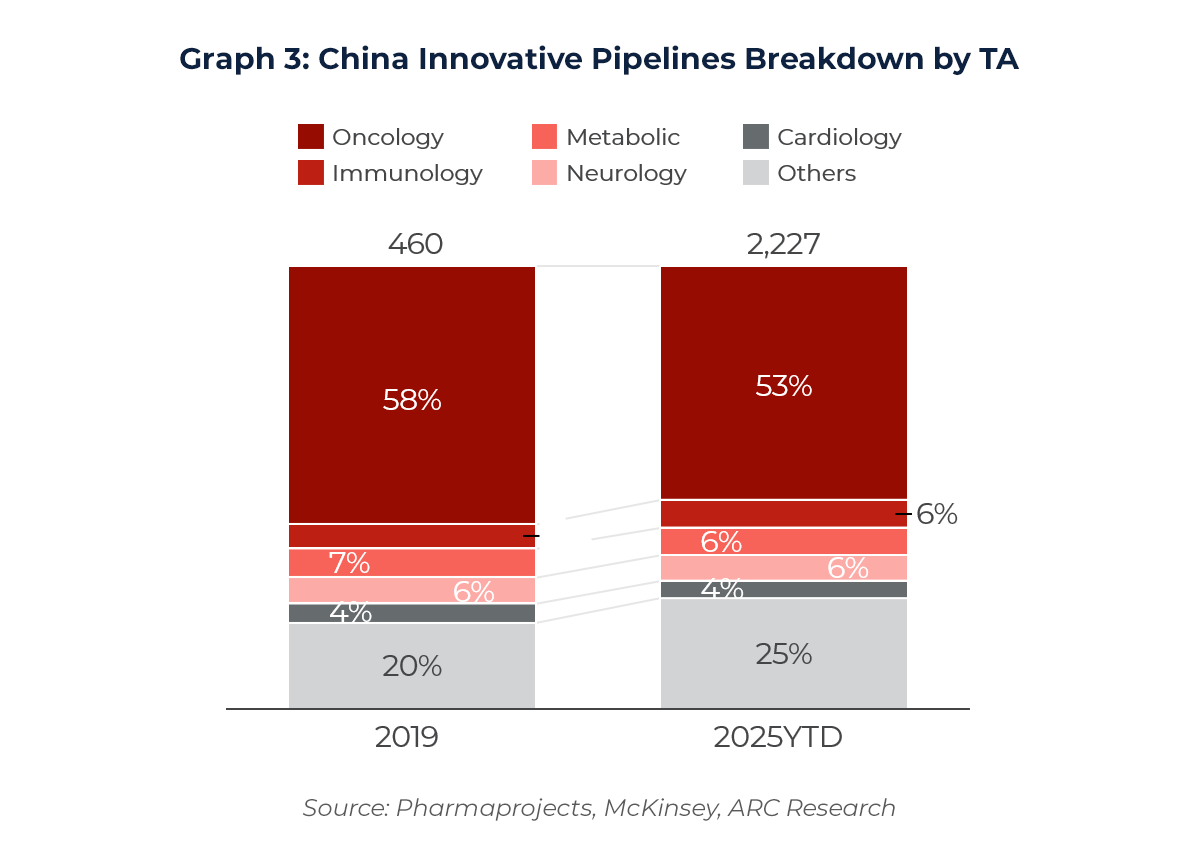
China’s innovative pipeline expanded from roughly ~460 assets in 2019 to 2,227 assets by Q3 2025. Oncology remains the anchor at ~53% of the pipeline today, but concentration is gradually decreasing versus 2019 (when oncology was ~58%). The headline message is: Oncology still dominates, but the pipeline is diversifying.
 Within non-oncology, the major categories are relatively balanced:
- Metabolic: ~6%
- Neurology/CNS: ~6%
- Immunology: ~6%
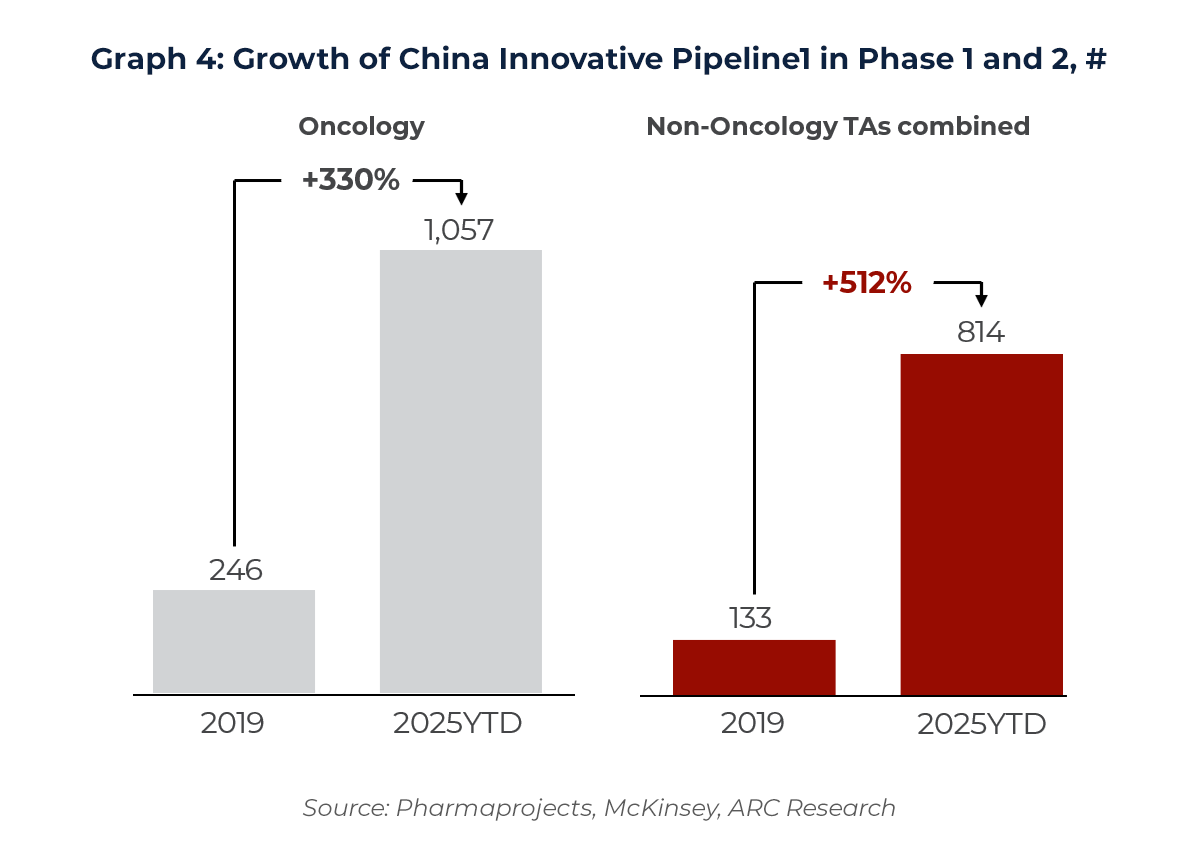
The diversification becomes even clearer when we focus on early clinical stages (Phase 1 and Phase 2). Phase 1–2 programs grew about +330%, but non-oncology grew even faster at +512%. That tells us the next wave of China innovation is expanding beyond oncology – gespecially into metabolic/cardiometabolic, CNS, and broader immune-related biology – gand importantly, a lot of that expansion is happening in early clinical stages right now.
4) Why China became such a major innovation source: faster and cheaper iteration at the system level
The benchmarks are quite striking. From target nomination to IND, China can be about 2 to 3 times faster, and discovery costs are often around one-third to one-half of global best practice. In clinical development, enrollment can be 2 to 5 times faster, and the per-patient cost is typically less than half of the US or Europe.
Now, the important part is: this is not just labor cost—it’s driven by three structural factors.
First, a nurturing macro environment: policy support and regulatory modernization, have lowered friction for innovation and made development pathways more predictable. With clearer rules, faster review cycles, and stronger encouragement for innovative R&D, companies can move programs forward with less “administrative drag,” which directly compresses timelines and improves capital efficiency.
Second, a scaled end-to-end ecosystem: China has built a dense, integrated biopharma supply chain—clinical sites and investigators, CROs, CDMOs, manufacturing capacity, and experienced talent are available at scale and often geographically concentrated. —so you can move from discovery to clinic without rebuilding the chain each time.
Third, delivery-focused ways of working: Many China biotech teams operate with aggressive timelines, parallel workstreams, and a strong bias toward execution. Decisions are made quickly, experiments and development tasks run in parallel, which compresses development time.
China is a place where partners can generate data and reach early clinical inflection points quickly.
5) From IP volume to IP value: the next upgrade is global-grade monetization
China now accounts for the majority of new biotech patents—about 51% in 2023, and its patent growth has been much faster than other regions over 2018–2023.
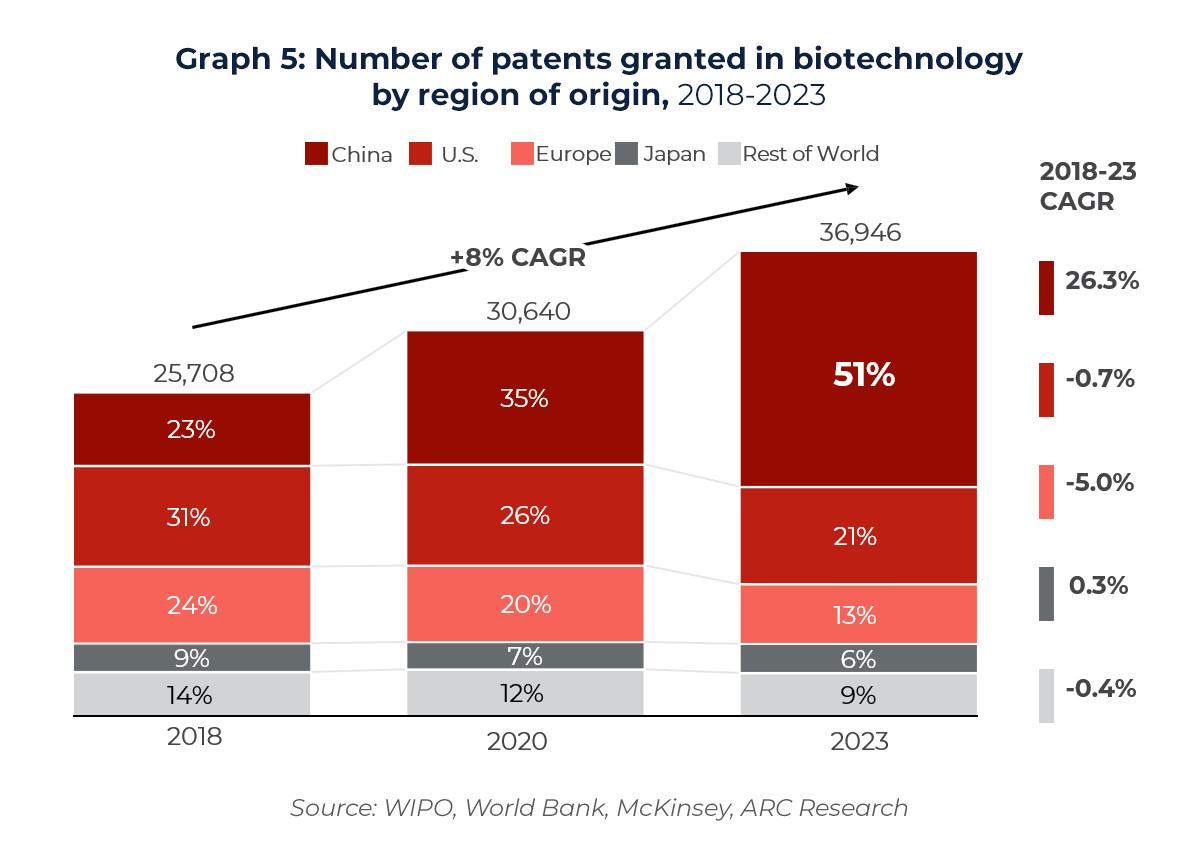
However, patent volume doesn’t automatically translate into IP value. The next phase is improving global-grade IP strategy—claim quality, FTO discipline, and international filing—and improving translation into revenue through stronger translational research, tech transfer, and CMC. That’s exactly why outbound licensing and NewCo structures are becoming more common: they are mechanisms to monetize IP globally.